CRM Control Groups: How an Email Service Inflated the Effect of Campaigns 16× and How to Check Your Report
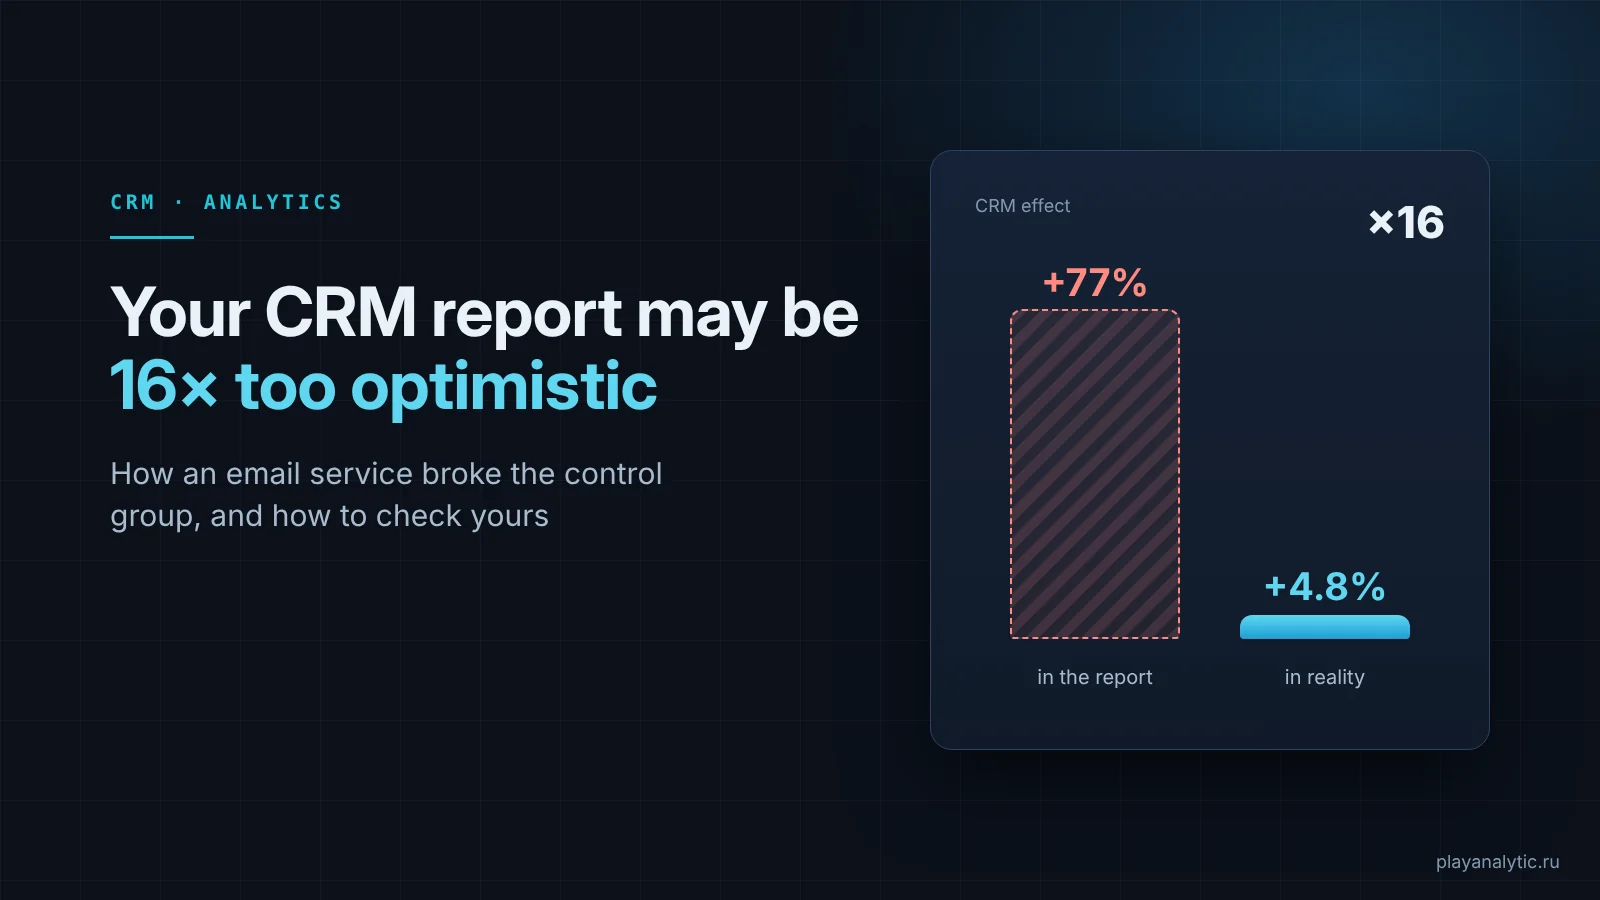
A real case: the first estimate of CRM campaigns showed +77%, the correct one by the original random split was +4.8%. Where control groups break and 7 checks for your report.
In short
- A retail chain’s first estimate of its CRM campaigns was +77% to purchase conversion. The correct estimate, by the original random split, was +4.8%. A 16× difference.
- The formula was fine. The email service filtered inactive customers out of the test group but barely touched the control group. So “live” customers were compared with “everyone”.
- Statistical significance does not catch this kind of error. Below: how to recalculate the effect, how to check your report in an hour and 7 checks before a budget decision.
Why a CRM campaign report can overstate the effect
A retail chain with an online store came to us. The team had measured the effect of CRM campaigns and got +77% to purchase conversion. A plan was already being prepared around that number: send more, wider and more often.
We rechecked the calculation and got +4.8%. Nobody massaged the data, the formula was correct, there was a control group and the split was random. The error appeared at a step analysts rarely think about: uploading customers to the email service.
Business takeaway: before increasing your CRM budget, check how its effect was calculated. A 16× difference is not a rounding error, it is a different decision.
Why CRM needs a control group
Some customers would have bought anyway. A regular customer will come on Friday even if they didn’t get a text on Thursday. Credit that purchase to the campaign and the report looks great while the money spent on texts is wasted.
A control group is customers who deliberately receive nothing. The difference in purchases between them and the recipients is the incremental effect of the campaigns, or uplift. The same question, “what would have happened without us”, is at the heart of an attribution audit for ad channels.
Business takeaway: without a control group you are also paying for purchases that would have happened anyway.
How we set up the test: a global control group
The goal was to understand how much all CRM communications together (SMS, push and email) bring on top of purchases customers would have made on their own.
We designed a global control group: customers who receive nothing through any channel for a whole month. This design shows the effect of the entire CRM program rather than a single campaign that overlaps with all the others.
The base was split randomly, 50/50. Before launch we checked the balance: the groups must have similar purchase histories before the first message. If one group has more active customers from the start, the result is biased from day one.
Everything was by the book. But a balance check looks at the groups at the moment of the split, and tests often break later. Learn more about how we design such experiments on the A/B testing and experiments page.
Business takeaway: a correct test design does not guarantee a correct number. Check the whole data path, from the split to the report.
Where the control group breaks
Before sending, customers are uploaded to the email service, which filters out people you cannot or should not contact: no marketing consent, invalid phone or email, unsubscribed. That is exactly what the service should do.
But nothing was sent to the control group, so it never went through the full check and was cleaned only by basic rules. After this step the groups were no longer alike: 52% of customers dropped out of the test group and only 18% out of the control group. And those who dropped out were not random: they were less active customers.
The test group kept customers with consent, working contacts and no unsubscribes. They buy more often anyway. In the control group, inactive customers stayed in place. The first estimate compared everyone the service kept with the entire control group. Hence +77%. That is not the difference between “messaged” and “not messaged”, it is the difference between active customers and everyone.
Such a number looks plausible, and a significance test won’t catch it. Significance tells you the difference between the groups is not random, but not where it came from. Here it came from the filter. And a big positive number rarely raises questions: people question bad numbers, not good ones.
There are two fair ways to compare the groups: compare them whole, exactly as they were split, or filter both groups the same way before the split.
Business takeaway: the error hides not in the formula but in how data passes through the email service. If a report compares the customers the service kept with the entire control group, the effect is most likely inflated.
How to recalculate the effect: compare by the original split
We went back to the original random split and compared everyone assigned to the test group with everyone assigned to control, including those the service filtered out and who never received a message. In statistics this is called intention-to-treat.
Why include people who received nothing? It is the only way to keep the groups identical in everything except the campaigns. Drop someone from one group only, and the comparison again becomes “active versus everyone”.
The approach has a cost: it dilutes the effect slightly, because the test group still contains people who got no messages. But the error goes in the safe direction: the estimate is conservative rather than inflated. For a budget decision, that is exactly what you need.
The result:
- +4.8% to purchase conversion across the whole test group instead of +77%.
- +7.2% among those who actually received the message. We took delivery statuses from the client’s analytics, where the email service sends them. This number is less reliable: delivery is only visible in the test group, and the control group has no “matching” people to compare with. So the decision was based on +4.8%.
Separately, we ran a segmented A/B test of SMS. Among high-spending customers who hadn’t bought for a long time, SMS brought customers back noticeably better than the base average.
Business takeaway: the estimate is more modest, but you can rely on it. It’s easy to build a budget on +77% for an effect that doesn’t exist.
When the confidence interval includes zero
There is a detail case studies usually skip. The revenue effect is positive but borderline: the confidence interval includes zero.
A test gives you not an exact number but a range where the true effect most likely lies. If the whole range is above zero, the campaigns make money. If it includes zero, you cannot rule out that there is no revenue effect at all, even if the average looks decent.
This is common with revenue: it varies a lot from customer to customer, and a few large purchases in one group can move the average more than all campaigns in a month. That is why a small revenue effect is harder to prove than a conversion effect.
We told the client about it ourselves and immediately planned a repeat test with a control group cleaned by the same rules as the test group. If it confirms the effect, the decision will stand on solid ground. If not, the money stays in the company.
Business takeaway: an honest “there is an effect, but we are not very sure” costs less than confident scaling based on an error. If you are shown a single number without a range, ask for the range.
What the business got
- A working estimate of how much CRM brings on top of “they would have bought anyway”. It no longer depends on who the email service filtered out.
- A scaling criterion: a campaign is expanded only if it brings margin after discounts and channel costs. Conversion growth alone says nothing about money. A campaign with a promo code can lift sales and still lose money if the discount goes to people who would have bought without it.
- An answer to the question of whom to message. Each segment can be decided separately: is there uplift, and does it cover the costs? A reminder to someone who buys every week adds almost nothing, but it can bring back a customer who disappeared six months ago.
See the case study for details, and the CRM incrementality page for how we measure campaigns.
How to check your report in an hour
If you already have a campaign report with a control group, three queries will show whether you can trust it. Table names are illustrative: you need an assignment table (customer, group, whether they passed the service filter) and an orders table.
Step 1. Group sizes at every step. Compare how many customers were assigned to each group and how many remained after the upload to the service.
SELECT grp,
       COUNT(*)                                     AS assigned,
       COUNT(*) FILTER (WHERE passed_filter)        AS after_filter,
       ROUND(100.0 * COUNT(*) FILTER (WHERE passed_filter) / COUNT(*), 1) AS kept_pct
FROM crm_test_assignment
GROUP BY grp;
If the share kept differs between groups by more than a couple of percentage points, you cannot compare the “kept” customers.
Step 2. Balance before launch. Compare the groups by behavior in the 90 days before the test: the share of buyers and the average number of orders should be nearly identical.
SELECT a.grp,
       COUNT(*)                              AS clients,
       AVG((COALESCE(o.orders, 0) > 0)::int) AS share_buyers_90d,
       AVG(COALESCE(o.orders, 0))            AS avg_orders_90d
FROM crm_test_assignment a
LEFT JOIN (
  SELECT client_id, COUNT(*) AS orders
  FROM orders
  WHERE order_date >= DATE '2026-03-01' - INTERVAL '90 days'
    AND order_date <  DATE '2026-03-01'   -- test start date (example)
  GROUP BY client_id
) o USING (client_id)
GROUP BY a.grp;
If the groups differed before the first message, the effect is biased from the start.
Step 3. Effect by the original split. Calculate conversion for everyone assigned to each group, without the service filter, and compare it with the number in the report.
SELECT a.grp,
       COUNT(*)                                AS clients,
       AVG((COALESCE(o.orders, 0) > 0)::int)   AS conversion
FROM crm_test_assignment a
LEFT JOIN (
  SELECT client_id, COUNT(*) AS orders
  FROM orders
  WHERE order_date BETWEEN DATE '2026-03-01' AND DATE '2026-03-31'  -- test period (example)
  GROUP BY client_id
) o USING (client_id)
GROUP BY a.grp;
If the uplift here is noticeably smaller than in the report, the report is inflated. For a decision, add a confidence interval and convert the uplift into margin.
Checklist: 7 checks for a CRM campaign report
You can ask these questions of your team or your contractor.
- Group sizes match the plan. You planned 50/50, but the groups in the report differ noticeably? Some customers were lost along the way, and probably not at random.
- The groups were similar before launch. Compare purchase histories before the test.
- You know where contacts are filtered. Does filtering out customers without consent, with invalid contacts and unsubscribed happen before the split or after?
- The same rules apply to both groups. Any filter applied to the test group must also be applied to the control group, even if it receives nothing.
- Comparison by the original split. Everyone assigned to test versus everyone assigned to control. Significance does not replace this check.
- The report shows a range, not a single number. If the confidence interval includes zero, the effect is not proven.
- The effect is calculated in margin. Subtract discounts and channel costs. If nothing is left, there is nothing to scale.
If even one check fails, it’s too early to trust the report. That doesn’t mean the campaigns don’t work. It means you don’t know yet.
A 16× error requires neither bad intent nor a broken formula: one filter in the wrong place is enough. For a similar trap with discounts, see the article “The Effect of a Discount in an Online Game”.
If you have doubts about your campaign report, tell us about your task: in a free 30-minute call we will look at whether you can trust it and what to check first.
FAQ
How big should a control group for CRM campaigns be?
It depends on the size of your customer base and the effect you want to detect. The smaller the expected uplift, the larger the control group. A small conversion effect usually needs tens of thousands of customers in each group. Calculate the size before launch: otherwise you can hold customers out for a month and still see no difference.
Can you measure the effect of CRM campaigns without a control group?
Your email service report shows how many purchases recipients made, but not how many would have happened without the message. Before-and-after comparisons are distorted by seasonality and promotions. Without a control group you will most likely overestimate the effect, especially among loyal customers.
What is the difference between a global control group and a control group for a single campaign?
A global control group contains customers who receive no messages through any channel for the whole test period. It shows the effect of the entire CRM program. A control group for one campaign measures only that campaign, and the result gets mixed with other communications the customer received at the same time.
What is intention-to-treat and why include customers who received nothing?
Intention-to-treat compares groups exactly as the random split created them: everyone assigned to the test versus everyone assigned to control. If you drop undelivered customers from the test group only, the groups are no longer comparable and the effect is inflated. The estimate by the original split is slightly more conservative, but you can trust it.